
Image source: Invezz
NYSE: BE | Research view: Strong Sell
Bloom Energy has become a credible beneficiary of the race to power AI data centers. Second-quarter revenue reached $1.065 billion, up 165.5% from a year earlier, and GAAP operating income was $182.2 million. Management now expects $3.9 billion to $4.2 billion of revenue in 2026, roughly twice the 2025 total at the midpoint.1 The question for the stock is how much of that growth can become durable cash profit.
This research is dated September 20, 2026. Because U.S. markets are closed today, the latest available regular-session close is $265.63 on September 18.14 At that price, a dilution-aware bridge puts Bloom’s economic enterprise value near $83.5 billion, or 20.6 times the midpoint of 2026 revenue guidance and 12.3 times an external 2027 revenue estimate of $6.79 billion. The latter is not company guidance.15, 16
Why earlier power matters
A data center cannot generate revenue from installed compute that has no usable electricity. Onsite generation can have economic value when it brings a facility online ahead of a utility interconnection, although that value falls if cooling, chips, networks or customers are not ready at the same time. The IEA projects global data-center electricity use of about 950 TWh in 2030, versus 485 TWh in 2025. For the United States in 2030, the IEA estimates 426 TWh while Lawrence Berkeley National Laboratory’s reference case is 649 TWh, with a 521–843 TWh sensitivity range. These are demand forecasts, not Bloom revenue forecasts.7, 8
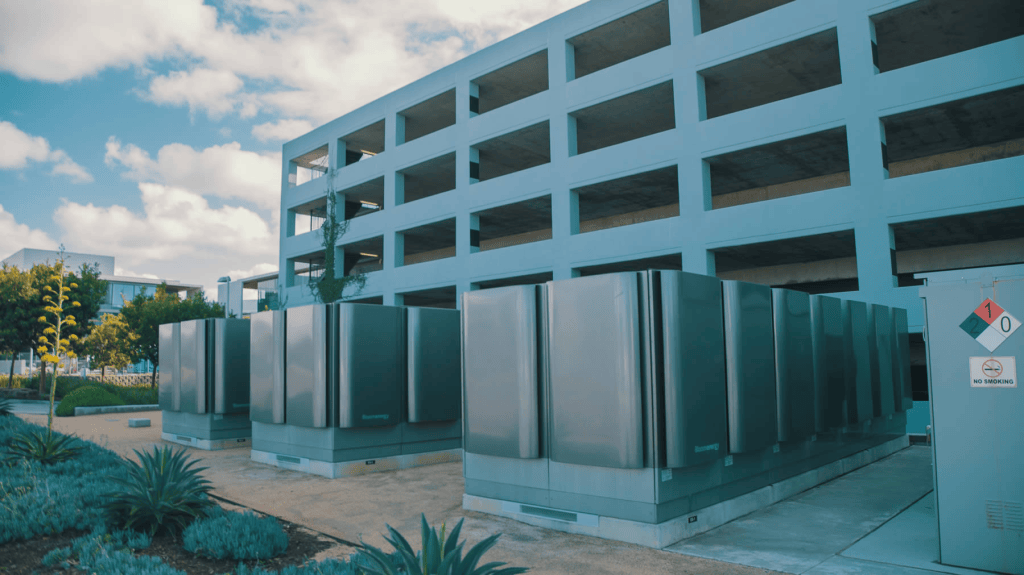
Bloom’s solid-oxide fuel cells are modular and can be deployed at customer sites. Its February product sheet specifies a 325 kW module and 53%–65% electrical efficiency on a lower-heating-value basis. Natural-gas operation still has direct emissions and requires a secure gas supply. Under illustrative assumptions of an installed cost of $6,000 per kW, 90% utilization, a 20-year life, a 10% discount rate, a delivered gas price of $5 per MMBtu and $25 per MWh for maintenance, generation costs about $147 per MWh before credits. The installed-cost and maintenance inputs are analyst assumptions; contract prices are not public.9, 16
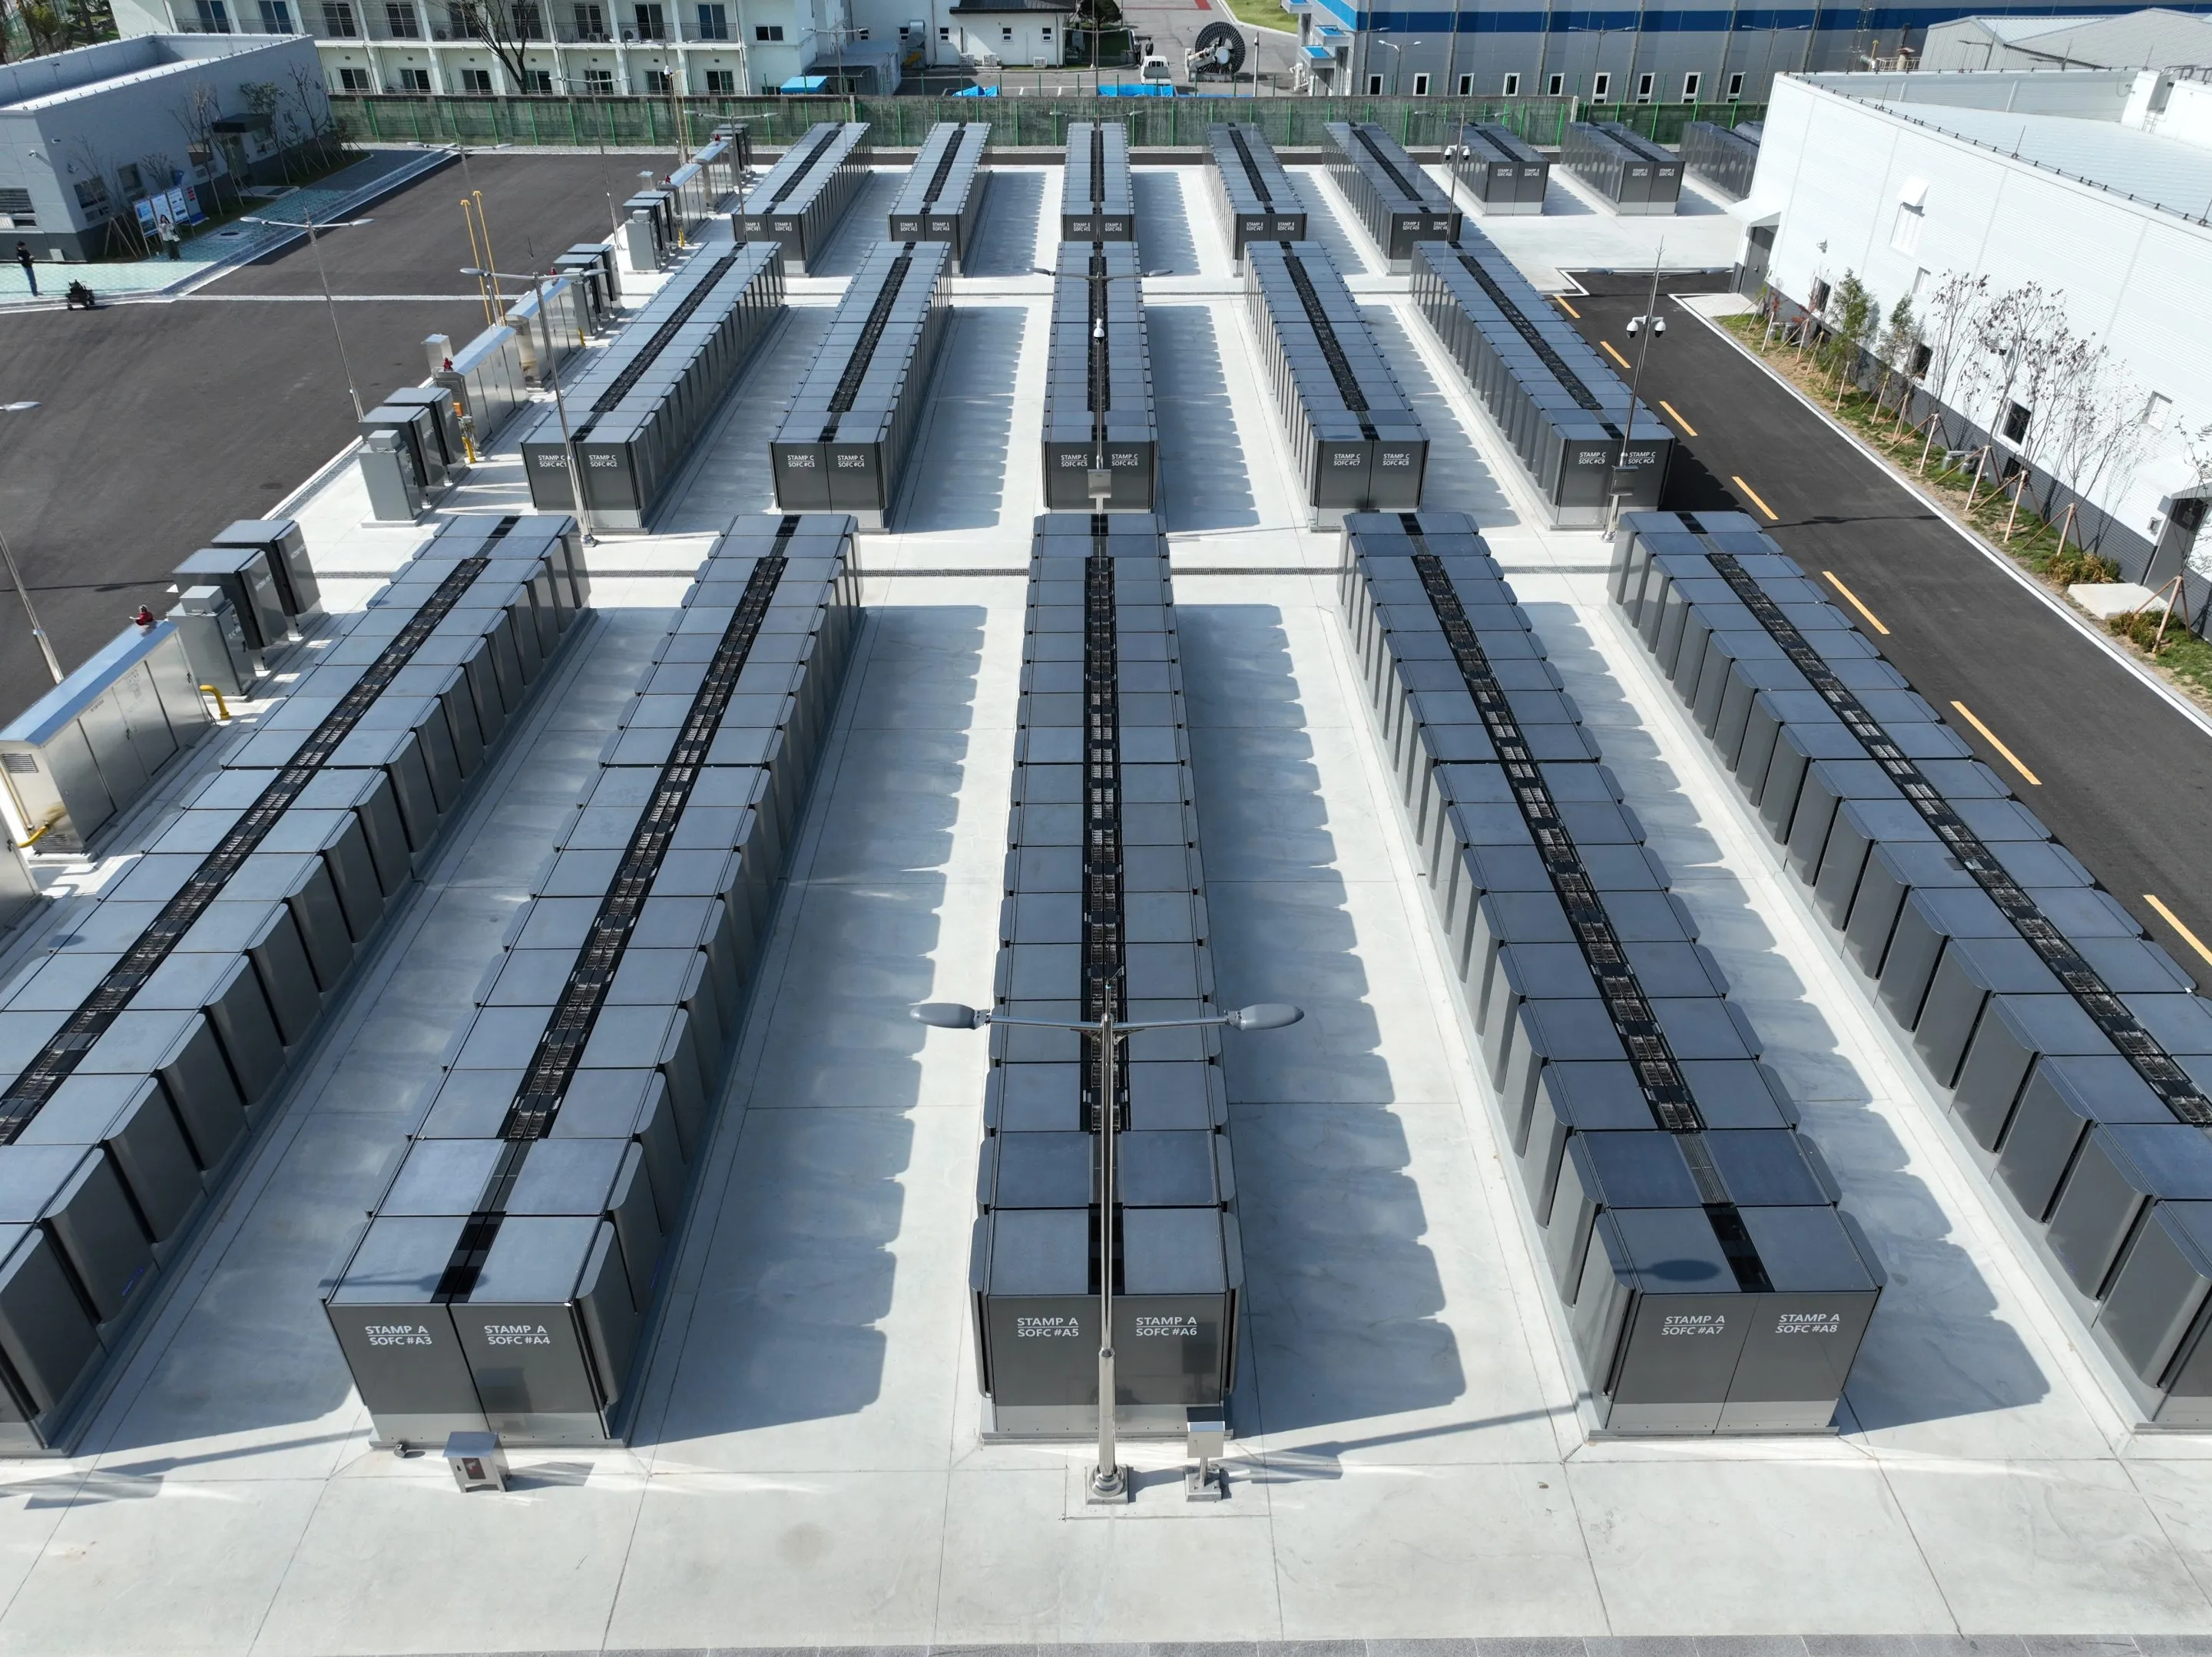
Bloom’s September analysis of an 800V DC-native design estimates $3.6 billion less non-compute capital expenditure and $5.5 billion less five-year total cost of ownership for a modeled 1 GW AI data center. These are company model estimates, not verified savings from an operating project. Wärtsilä’s 412 MW Ohio gas-engine order shows that other technologies are pursuing primary off-grid data-center power.13, 10
From contract to cash
Bloom’s largest relationships support the demand case, but they do different jobs. Oracle’s master agreement contemplates up to 2.8 GW, including an initial 1.2 GW already contracted for deployment into 2027. Brookfield’s $25 billion framework addresses project financing and remains subject to investment criteria. AEP disclosed an approximately $2.65 billion unconditional fuel-cell purchase covering much of its 1 GW option, while a separate 20-year power offtake remained conditional. Equipment orders, plant operation and Bloom’s eventual cash collection are distinct milestones.4, 5, 6
Bloom reported about $20 billion of company-defined backlog in February, including roughly $6 billion of product backlog. A September county presentation repeated that dated figure; it did not provide a new roll-forward. The $494.1 million of remaining performance obligations in the June filing is a narrower accounting measure with different contract-scope rules. Neither total should be read as cash already earned.11, 12, 2
Rapid growth, with cash-flow qualifications
The improvement in reported results is substantial. All figures below are GAAP except free cash flow, defined here as operating cash flow less cash purchases of property and equipment. H1 2026 covers six months; the other columns cover full years.1, 2, 3
| USD millions, except margin | FY2023 | FY2024 | FY2025 | H1 2026 |
|---|---|---|---|---|
| Revenue | 1,333.5 | 1,473.9 | 2,024.0 | 1,816.4 |
| GAAP gross margin | 14.8% | 27.5% | 29.0% | 32.0% |
| GAAP operating income | (208.9) | 22.9 | 72.8 | 254.4 |
| Operating cash flow | (372.5) | 92.0 | 113.9 | 300.0 |
| Cash capex | 83.7 | 58.9 | 56.8 | 77.8 |
| Free cash flow | (456.3) | 33.1 | 57.2 | 222.2 |
FY2023 gross margin includes substantial impairment charges, so the subsequent increase is not entirely an efficiency gain.3
H1 operating cash flow included a $301.2 million increase in deferred revenue and customer deposits. Removing only that contribution mechanically would turn the $222.2 million of reported free cash flow into approximately negative $79 million. That is not normalized free cash flow: inventory, billing terms and other working-capital movements also need adjustment. A $58.3 million specific warranty reserve charged to product cost of revenue is another reason to follow cash returns after shipment, not just equipment gross margin.2
At June 30, Bloom held about $2.667 billion of cash against roughly $2.53 billion of modeled debt principal. Cash growth includes financing activity and should not be treated as operating profit. One unnamed, non-related customer represented 73% of Q2 revenue. Related-party revenue fell to $2.8 million from $373.3 million in Q1, which demonstrates sales outside those relationships but not yet a diversified customer base. Bloom also carried a $306.5 million Oracle customer-consideration asset to be recognized against future revenue as related systems are delivered.2, 16
What the share price appears to require
A ten-year discounted cash-flow model makes the valuation test explicit. These are assumptions, not management forecasts or 12-month price targets. Each case includes cash taxes, depreciation, capital expenditure, incremental working capital and terminal reinvestment. Stock compensation remains an operating cost, and the equity bridge allows for dilution and conversion-dependent debt.16
| Scenario input / outcome | Bear | Base | Bull |
|---|---|---|---|
| 2027 revenue | $4.8B | $6.79B | $7.5B |
| 2030 revenue | $7B | $13B | $20B |
| 2036 revenue | $10B | $25B | $50B |
| Long-term EBIT margin | 18% | 24% | 30% |
| Discount rate | 13% | 11% | 9% |
| Perpetual growth | 2% | 3% | 3% |
| Modeled value / share | ~$19 | ~$86 | ~$296 |
| Versus $265.63 close | −93% | −68% | +12% |
Even the Base case assumes revenue rising to $25 billion by 2036 and a 24% long-term EBIT margin, yet its modeled value is about $86 per share. The Bull case reaches $50 billion of revenue and a 30% margin; even there, about 71% of operating value lies in the terminal period. Holding Base margin, tax, reinvestment and the 11% discount rate fixed, a smooth revenue path beginning at $6.79 billion in 2027 would need roughly 35% annual growth through 2036 to match the September 18 market enterprise value. It would reach about $100.8 billion of revenue in 2036. This is a reverse-valuation illustration, not a Bloom forecast.16
The model is sensitive to discount rates, terminal returns and the conversion of growth into cash. It does not fully capture site-level economics, future financing needs or tax-loss carryforwards. Its purpose is to expose the operating burden in the current price, not to offer a precise trading target.
What would change the view
A more constructive case would require accepted equipment translating into collections, repeat orders across more independent customers, and margins that hold after warranty expense and Oracle consideration. Evidence that planned expansion from 2 GW to 5 GW of annual manufacturing capacity becomes commissioned output and customer-accepted MW would strengthen the delivery case. Rising contract assets or inventory without cash receipts, persistent customer concentration, gas or permitting delays, and competing onsite solutions that close the timing gap would weaken it.2, 12
Bloom’s recent results and contracted deployments justify close attention. At the latest available price, however, the equity already assumes long-lived growth and substantial returns on the capital required to deliver it. My stance is cautious until cash conversion and customer breadth provide stronger evidence that the value of earlier power can become lasting returns for shareholders.
Notes and sources
- Bloom Energy Q2 2026 earnings release, July 28, 2026. Revenue, GAAP results and guidance.
- Bloom Energy Q2 2026 Form 10-Q/A, July 29, 2026. Concentration, cash flow, warranty, assets and debt.
- Bloom Energy FY2025 Form 10-K, February 9, 2026. Annual financial statements.
- Bloom–Oracle partnership announcement, April 13, 2026. Initial 1.2 GW and up-to-2.8 GW master agreement.
- Bloom–Brookfield framework announcement, June 30, 2026. Conditional financing framework.
- AEP Q2 2026 Form 10-Q, PDF page 22. Equipment purchase and conditional power offtake.
- IEA, Key Questions on Energy and AI, April 2026. Data-center electricity projections.
- Lawrence Berkeley National Laboratory, United States Data Center Energy Usage Report: 2025 Update, June 2026. U.S. demand scenarios.
- Bloom Energy Server datasheet, February 2026. Module size and manufacturer efficiency specifications.
- Wärtsilä announcement, April 16, 2026. 412 MW Ohio gas-engine data-center order.
- Bloom Energy FY2025 earnings release, February 5, 2026. Company-defined backlog.
- Oracle/Bloom presentation to Doña Ana County, September 8, 2026, PDF page 15. Capacity plan and dated backlog.
- Bloom Energy 800V DC design analysis, September 16, 2026. Company-modeled savings.
- BE historical prices, accessed September 20, 2026. September 18 close.
- BE public financial forecasts, updated September 15, 2026. External 2027 revenue estimate.
- Sterling & Shin Research Team calculations based on the sources above. Valuation and generation-cost scenarios are illustrative assumptions, not price targets or management forecasts.

