

Data as of the September 24, 2026 close; real-yield comparison through September 23
The 10-year Treasury yield just hit its highest level since 2007. What does that number actually mean, who sets it, and why does it matter? A plain-English guide, plus our read on where rates go next.
Part 1: Interest rates from zero
What is an interest rate?
An interest rate is the price of money over time. If you borrow $100 today and have to pay back $105 in a year, using that $100 for a year costs you $5, or 5%.
From the lender’s side, the rate is payment for three things:
- Time. You gave up using your money.
- Inflation. The dollars you get back later may buy less than the dollars you lent.
- Risk. The borrower might not pay you back, or a better opportunity might come along while your money is tied up.
Those are useful starting points for understanding the rates you’ll see on a mortgage, a credit card, or a government bond. Taxes, liquidity, and the terms of the loan also matter.
Who sets interest rates?
There are two sets of players, and mixing them up is the most common beginner mistake.
- The Federal Reserve sets a target range for its main policy rate. That’s the federal funds rate, a market rate for overnight borrowing between eligible financial institutions. The Fed uses its tools to keep that rate within its target range. On September 16, the Fed raised the range to 3.75%–4.00%, its first hike since 2023. This policy rate influences short-term borrowing costs: credit cards, savings accounts, the prime rate, and short-term government bills.
- The market sets Treasury yields. Nobody directly “sets” the 10-year Treasury yield. It emerges from the prices at which buyers and sellers trade U.S. government debt. The Fed can influence it, but doesn’t directly choose it. That’s why the 10-year can jump on a day the Fed does nothing, and why it can tell a different story from the current policy rate.
Think of it this way: the Fed controls the thermostat in one room, overnight money. The market decides the temperature in the rest of the house based on what it expects the thermostat to do next, plus the weather outside: inflation, government debt, and world events.
What is a bond?
A bond is an IOU you can trade. Suppose you buy a 10-year Treasury note with a face value of $1,000. The U.S. government pays you interest (the coupon) every six months for ten years, then returns the $1,000 face value at the end (at maturity).
A few words you’ll see constantly:
- Face value (par): the amount repaid at maturity, often illustrated as $1,000 or quoted as 100.
- Coupon: the fixed interest rate applied to the bond’s face value; for a conventional Treasury note, it determines the cash interest payments.
- Price: what the bond trades for today, which can be above or below par.
- Yield to maturity: the annualized rate that relates today’s price to the bond’s remaining coupon payments and repayment at maturity. It differs from the coupon, and your realized compounded return also depends on how you reinvest those payments.
The one rule to remember: when yields go up, bond prices go down.
Here’s why. You buy a 10-year bond paying 4% for $1,000. If the yield buyers require rises immediately to 5%, nobody will pay you $1,000 for that 4% bond. Its price has to fall until its remaining payments offer a 5% yield to maturity. That price is about $922, a 7.8% paper loss. “Bond selloff” and “yields surge” describe the same event.
The longer the bond, the bigger the price swing, all else equal:
| If yields rise from 4% to 5%, a bond paying 4%… | Price falls to | Loss |
|---|---|---|
| 2-year | ~$981 | −1.9% |
| 10-year | ~$922 | −7.8% |
| 30-year | ~$845 | −15.5% |
Illustration assumes a $1,000 face value, semiannual coupons, the full stated maturity remaining, and repricing on a coupon date.
This sensitivity is measured by duration. It’s why longer bonds generally carry more interest-rate risk than shorter ones, even when both are issued by the same government.
What kinds of bonds are there?
U.S. Treasury debt is a central benchmark for financial markets. Its marketable securities come in five varieties:
| Type | Maturities | How it pays | Why you’d watch it |
|---|---|---|---|
| Treasury bills | 4, 6, 8, 13, 17, 26, and 52 weeks | No coupon; generally sold at a discount, repaid at face value | Reflect current and near-term expected Fed policy |
| Treasury notes | 2, 3, 5, 7, and 10 years | Coupon every six months | The 2-year is sensitive to Fed expectations; the 10-year is the benchmark |
| Treasury bonds | 20 and 30 years | Coupon every six months | Long-run rate expectations, inflation risk, and government financing conditions |
| TIPS (inflation-protected) | 5, 10, and 30 years | Principal adjusts with CPI; interest is paid on the adjusted principal | Show quoted real yields, before taxes and fees |
| Floating-rate notes | 2 years | Rate adjusts with 13-week T-bill auction rates; interest paid quarterly | Mostly a cash-management tool |
Many U.S. dollar bonds are discussed as “Treasury yield + a spread”, with the spread reflecting factors such as credit risk, liquidity, and repayment options. The wider bond market includes:
- Corporate bonds: investment grade (stronger credit ratings) or high yield (“junk,” generally weaker credit ratings and wider spreads).
- Municipal bonds: issued by states and cities, often tax-exempt, which changes how their yields compare with Treasuries.
- Mortgage-backed securities: bundles of home loans, with the added complication that borrowers can repay early.
- Foreign government bonds: Germany’s Bunds, Japan’s JGBs, Korea’s KTBs. Their yields also reflect local policy, currency, and inflation conditions.
That’s why Treasury yields matter so much. When they move, many other borrowing costs follow, although spreads can also change.
Why do the years matter? (the yield curve)
Different maturities pay different rates. If you plot yield against maturity, you get the yield curve. It often slopes upward, partly because investors want extra compensation for holding longer bonds. Each part of the curve helps answer a different question:
- 3-month bill: Where is the Fed now, and what might it do soon?
- 2-year note: Where does the market think the Fed will be over the next two years? This maturity is especially sensitive to policy expectations.
- 10-year note: The benchmark. Mortgages, corporate borrowing, and stock valuations key off it.
- 30-year bond: What are investors demanding to lend over decades, given inflation, interest-rate, and government financing risks?
When short-term yields are above long-term yields, the curve is inverted. That often points to expectations of rate cuts or slower growth, although the curve also reflects risk premiums and market demand.
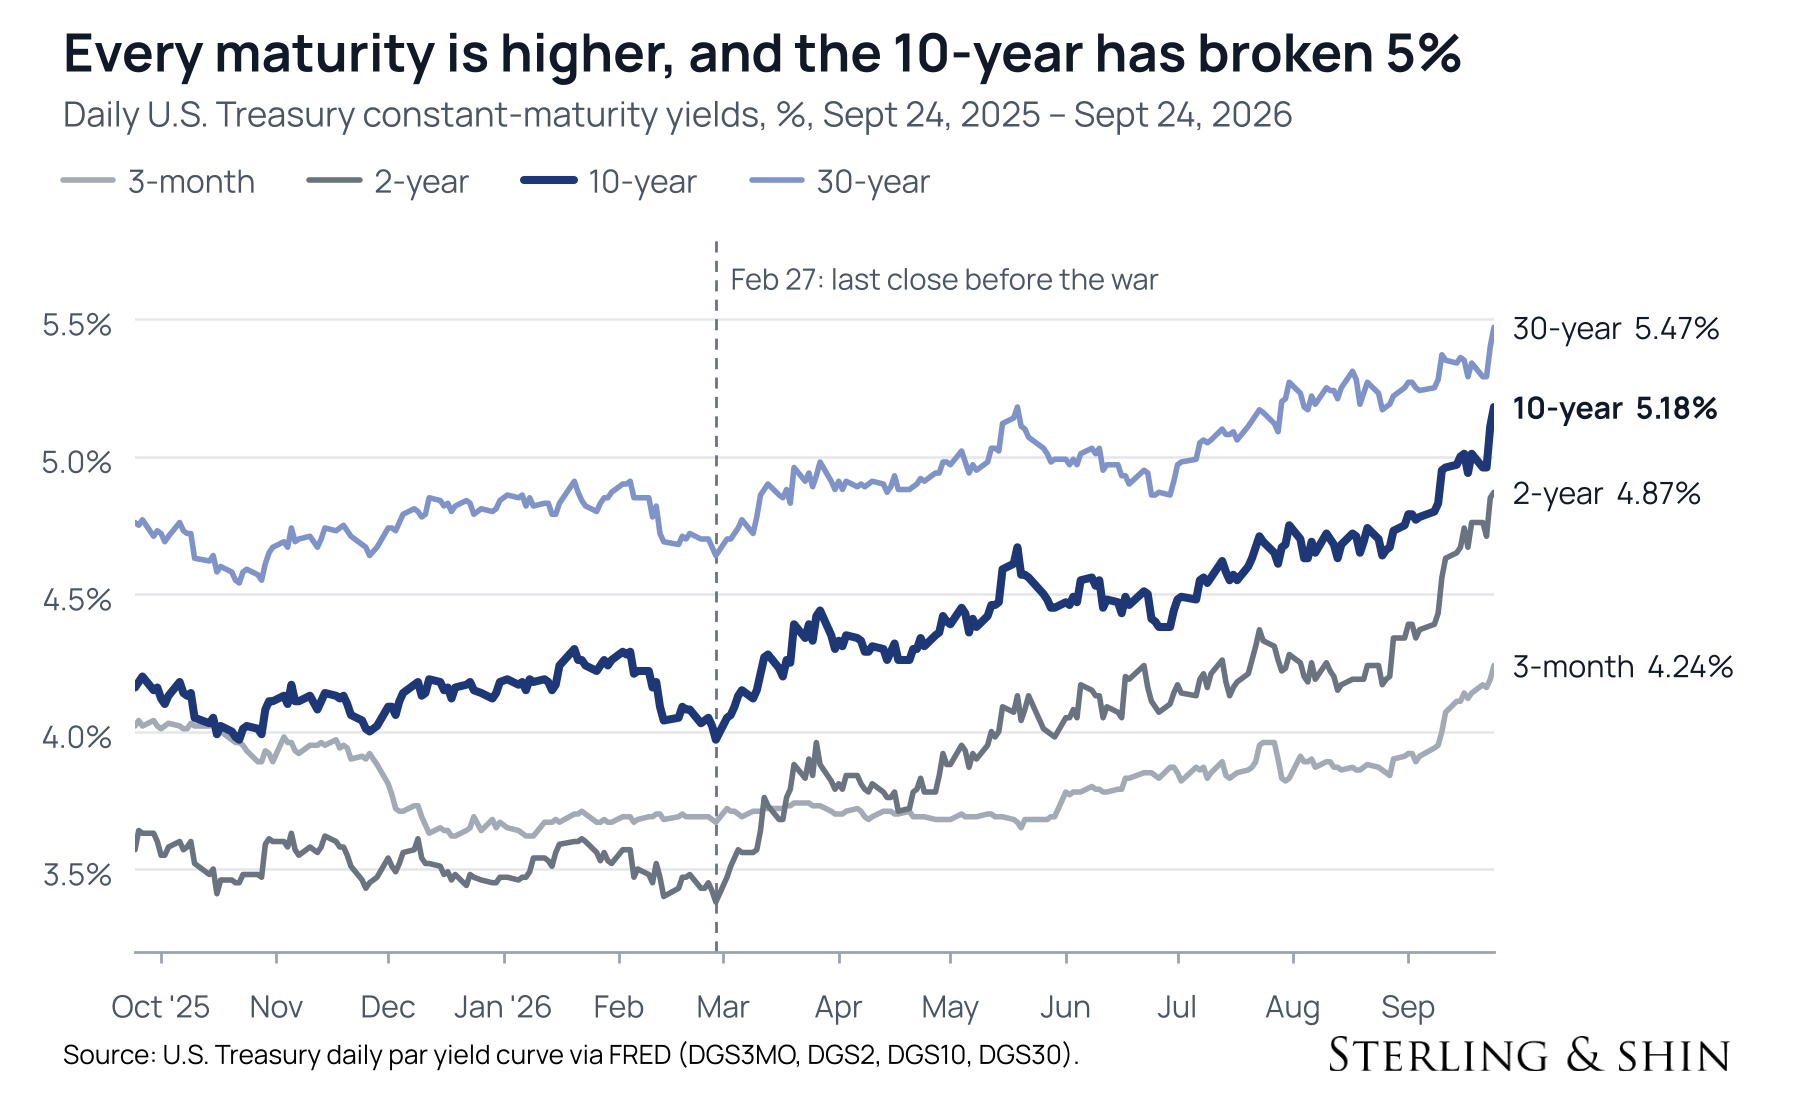
The chart shows how much the curve has changed. On February 27, the day before the U.S.–Israel war on Iran began, the 3-month bill paid 3.67% and the 2-year only 3.38%. That was consistent with expectations of cuts. On September 24, the 3-month rate was 4.24%, and the 2-year rate was 4.87%. The short end now slopes uphill, consistent with a substantial upward repricing of the expected policy path. The slope alone doesn’t tell us how many hikes to expect.
| Maturity | Feb 27, 2026 | Sept 24, 2026 | Change |
|---|---|---|---|
| 3-month | 3.67% | 4.24% | +57 bp |
| 2-year | 3.38% | 4.87% | +149 bp |
| 5-year | 3.51% | 5.03% | +152 bp |
| 10-year | 3.97% | 5.18% | +121 bp |
| 30-year | 4.64% | 5.47% | +83 bp |
A basis point (bp) is one-hundredth of a percentage point, so 100 bp = 1 percentage point.
What does “5.18%” actually mean?
It means three things at once.
- It’s a benchmark annualized yield. Treasury’s published 10-year par yield summarizes market pricing for a hypothetical bond trading at face value. The yield and coupon of an actual Treasury you buy can differ. Your cash payments depend on that bond’s coupon; your yield also reflects the price you pay and the amount repaid at maturity. A 5.18% benchmark does not mean every $10,000 Treasury investment pays exactly $518 in annual cash interest.
- It’s a hurdle for other assets. Treasuries are commonly used as a benchmark “risk-free” rate in U.S. dollars, although their market prices and purchasing power can change. If a government bond offers 5.18%, investors generally demand a higher return from a stock, a building, or a startup to compensate for additional risk. When this hurdle rises, other assets have to work harder to compete.
- It’s high for this generation, but not extreme by historical standards. It’s the highest since 2007. The 10-year reached much higher levels in the early 1980s and fell below 1% in 2020. What’s unusual isn’t just the level. It’s that many of today’s investors, homeowners, and CEOs built their plans during years when Treasury yields of 2%–3% were familiar.
Nominal vs. real. The 5.18% is a nominal yield. A real yield measures return in purchasing-power terms, and TIPS provide a market measure tied to CPI inflation. For a matched comparison, use September 23: the 10-year nominal par yield was 5.11%, and the real par yield was 2.76%, leaving a gap of 2.35%.
That gap is called breakeven inflation compensation. It reflects expected inflation, inflation risk premiums, and differences in liquidity between nominal Treasuries and TIPS. It is a useful market signal, not a pure inflation forecast. Keep the September 23 real yield and breakeven in mind; they’re central to Part 3.
Why does it matter to you?
- Mortgages. The 30-year mortgage rate often moves with the 10-year Treasury plus a variable spread. Freddie Mac’s average hit 7.03% this week, the first reading above 7% since January 2025. On a $400,000, 30-year loan, going from 6.00% to 7.03% adds about $271 a month in principal and interest, before taxes and insurance.
- Other loans. Car loans, business loans, and credit lines respond to Treasury yields, bank funding costs, and Fed policy, as well as the borrower’s credit risk.
- Savings. Cash pays more than it did in the near-zero-rate years. The 1-month Treasury benchmark yield is about 4%.
- Stocks. A higher discount rate makes future profits worth less today, all else equal. That weighs most on companies whose expected profits are far in the future.
- The government’s budget. The CBO put net interest on the federal debt at about $970 billion in fiscal 2025, rising to $2.1 trillion by 2036. Higher rates raise borrowing costs as debt is issued or refinanced; the entire debt stock doesn’t reprice overnight.
- The dollar and the world. Higher U.S. yields can attract foreign capital and support the dollar. The effect depends on why yields are rising and what happens to rates elsewhere; a stronger dollar can squeeze countries that import oil or borrow in dollars.
What moves interest rates? The nine forces
The simplest way to think about a long-term yield is to split it into building blocks. Here are two useful, approximate ways to do it:
Nominal yield ≈ real yield + breakeven inflation compensation
Long-term yield ≈ the average expected short-term rate over the bond’s life + a term premium
The term premium is the estimated compensation investors demand for holding long-term bonds rather than rolling over short-term investments. It can reflect uncertainty about inflation, interest rates, supply, and demand. It isn’t directly observable; different models estimate it differently, and it can fall below zero.
Here are the forces that push those blocks around and how I read them today:
| Force | How it works | Today’s reading | Potential push on yields |
|---|---|---|---|
| 1. Fed policy | Higher expected Fed rates lift yields, especially at shorter and intermediate maturities | The Fed hiked to 3.75%–4.00%; its median projection is 4.1% at the end of 2026 and 2027 | ↑ |
| 2. Inflation | Lenders seek compensation for lost purchasing power and inflation uncertainty | August headline CPI was 3.4% year over year and core CPI 2.4%; long-term breakevens have moved much less than real yields | Mixed; higher inflation can also prompt tighter policy |
| 3. Growth | A strong economy can mean more demand for credit and less need for cuts | S&P Global’s September flash survey signaled the fastest business activity growth in more than five years | ↑, if strength persists |
| 4. Bond supply | Bigger deficits mean more financing to absorb | CBO projects a 2026 deficit of 5.8% of GDP and debt held by the public at 101% of GDP | ↑, all else equal |
| 5. Bond demand | The price needed to attract buyers changes with their risk appetite and balance sheets | Auction results and investor demand are important tests, as financing needs remain large | Two-way |
| 6. Global yields | Investors compare returns across countries, including currency-hedging costs | Attractive alternatives abroad can reduce demand for Treasuries; currency costs complicate the comparison | Two-way |
| 7. Competition for capital | Private investment and government borrowing can compete for financing | The AI build-out adds to capital needs; its effect on rates depends on saving, productivity, and financing conditions | Potentially ↑ |
| 8. Safe-haven demand | Fear can send money into Treasuries, pushing yields down | Any safe-haven buying has not prevented the net rise in yields since February | ↓ when it strengthens |
| 9. Politics | Policy choices can change inflation, fiscal, and central-bank credibility risks | Fiscal decisions and confidence in monetary policy can affect both expected rates and risk premiums | Two-way |
Several forces lean toward higher yields, especially firmer expected Fed policy, resilient growth, and heavy government financing needs. These forces overlap; counting the arrows is not a model. But the combination helps explain why the selloff has been persistent.
How to follow rates yourself in five minutes a day
All of these are free:
- Treasury’s daily par yield curve: the official benchmark curve, across maturities.
- FRED, by series code:
DGS3MO,DGS2,DGS10,DGS30(nominal yields) ·T10Y2Y(the 2s10s curve) ·DFII10(10-year real yield) ·T10YIE(10-year breakeven inflation compensation) ·THREEFYTP10(a model estimate of term premium) ·MORTGAGE30US(mortgage rate). - CME FedWatch: probabilities implied by Fed funds futures, under the tool’s assumptions, for upcoming Fed decisions.
- Key dates now: September CPI on October 14; the next FOMC meeting on Oct 27–28; Treasury auction results every week.
Part 2: Reading today’s market
With that toolkit, three things stand out.
1. Everything rose, but the middle of the curve rose the most
Since February 27, the 5-year yield is up 152 bp and the 2-year yield is up 149 bp, compared with 121 bp for the 10-year and 83 bp for the 30-year. The 2- to 5-year zone is especially sensitive to the Fed’s path over the next few years. A major part of the story is a repricing of Fed policy: from expectations of cuts toward higher rates. The Fed’s September projections put the median policy rate at 4.1% at the end of both 2026 and 2027. That doesn’t make the curve a pure policy forecast, but it supports the direction of the repricing.
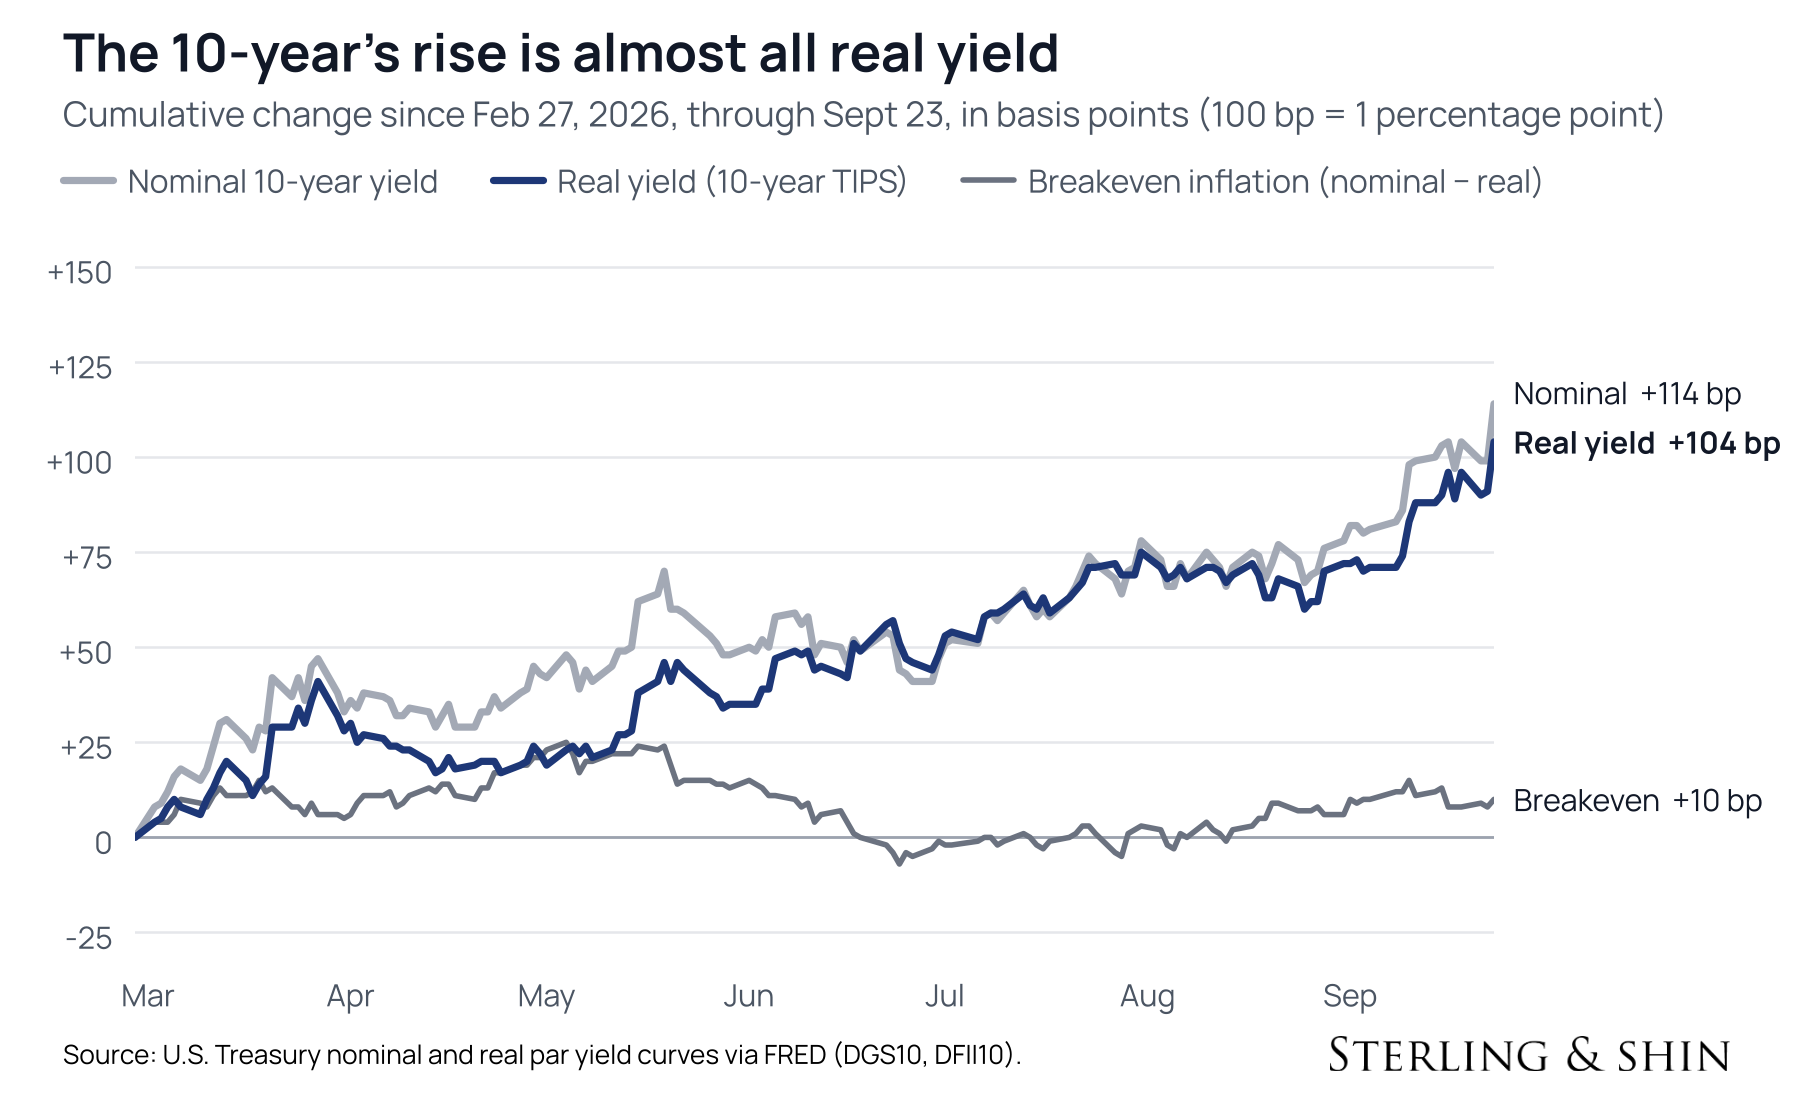
2. Almost all of the measured increase is in real yield
This is the part many headlines miss.
| Feb 27 → Sept 23, 2026 | 5-year | 10-year | 30-year |
|---|---|---|---|
| Total change in nominal yield | +148 bp | +114 bp | +76 bp |
| Change in real yield | +154 bp | +104 bp | +71 bp |
| Change in breakeven inflation compensation | −6 bp | +10 bp | +5 bp |
Computed from matched dates in Treasury’s par nominal and real yield curves. Breakeven here is the nominal minus real par yield spread. The comparison ends on September 23, one day before the nominal curve above. This is an accounting decomposition, not a causal model.
Headline CPI rose to 4.2% in May before easing to 3.4% in August. Yet the 10-year breakeven spread changed relatively little between February 27 and September 23, from about 2.25% to about 2.35%. The 5-year spread actually fell. Roughly 91% of the 10-year’s increase was in its measured real yield: 104 bp out of 114 bp.
That supports my reading that higher real yields, rather than a large increase in long-run inflation compensation, dominate this move. It doesn’t prove that inflation risk has disappeared. Breakevens reflect risk and liquidity effects, and real yields capture more than just expectations of future real policy rates. A 10-year TIPS auction cleared at a 2.65% real yield on September 17, another sign of the high inflation-adjusted returns investors are demanding.
3. The term premium is back
The Federal Reserve Board’s Kim–Wright model put the 10-year term premium near 0.96% as of September 18. That is a model estimate, not a directly traded price, and it can change or be revised.
As a rough illustration, a long-term yield of about 5% and a term premium of about 1% leave roughly 4% for the expected short-rate component. A precise decomposition must use the same model, yield convention, and date. The illustration nevertheless shows why long yields can remain above the Fed’s 3.2% median long-run policy rate estimate: the decade-average expected rate and the term premium are separate ingredients.
The Fed’s balance sheet matters too. Reserve-management purchases are directed mainly toward Treasury bills, but maturing Treasury holdings are also rolled over at auction, including into coupon securities. So it would be wrong to say the Fed has stopped buying long bonds altogether. The more relevant question is how much duration the public must absorb, given Treasury issuance, the Fed’s holdings, and private demand.
Part 3: Our conclusion
My read: the 5% 10-year is mainly a real-rate reset, and only part of it is the war.
My reasoning comes in four steps.
Step 1: Measured real yields are doing most of the work. If the story were simply a surge in long-run inflation compensation, I would expect a much larger rise in breakevens. Instead, the 10-year spread is around 2.35%, and the 5-year spread is lower than before the war. This is consistent with investors expecting policy to restrain inflation. What changed most is the quoted price of money after inflation: 10-year real yields went from 1.72% to 2.76% between February 27 and September 23. That is strong evidence for a real-yield repricing, though not proof that the market has no inflation concerns.
Step 2: That repricing has cyclical and potentially persistent influences.
- The cyclical influences: an oil shock, a strong economy, and a Fed that chose to hike. Policy expectations matter especially in the 2- to 5-year part of the curve, and they can reverse. If oil falls and the Fed no longer sees a need to hike, some of the roughly 150 bp rise in that sector could unwind.
- The potentially persistent influences: large government financing needs, private demand for capital, and the return investors require for bearing long-term risk. The government is running deficits near 6% of GDP, interest costs are approaching $1 trillion a year, and the AI build-out adds to private capital needs. Investors also have alternatives abroad. These forces can help keep long-term yields elevated after the immediate shock fades.
The distinction is useful, but it isn’t a clean split by maturity. Both sets of influences can move expected rates and term premiums across the curve. The term premium is not inherently permanent, and a ceasefire or recession could change it as well.
Step 3: My scenario math leaves room for a higher normal range. Use the second building-block formula: the long-term yield is approximately the average expected short-term rate plus a term premium. The table below contains my illustrative assumptions, not forecasts supplied by the Fed or an exact valuation model.
| Illustrative scenario | Avg. short-term rate, next 10 yrs | Term premium | Approx. 10-year yield |
|---|---|---|---|
| Peace, with policy gradually returning toward the Fed’s 3.2% longer-run estimate | ~3.5% | ~1.0% | ~4.5% |
| An illustration broadly consistent with today’s yield level | ~4.0% | ~1.0% | ~5.0% |
| Fiscal stress or persistent inflation pressure | ~4.0%–4.5% | ~1.5% | ~5.5%–6.0% |
In my benign scenario, the war ends, oil normalizes, and policy gradually eases, but the term premium remains near 1%. That still gives a 10-year yield of around 4.5%. My base case is that the 10-year’s normal range is roughly 4.5% to 5.5%. The war helps determine where we sit, while other forces can keep rates elevated after it ends.
That range depends on my assumptions. It is not a floor established by arithmetic. A recession, a lower expected path for short-term rates, or a substantial fall in the term premium could take the 10-year below 4%. I don’t think 3% is the normal destination, but I can’t rule it out.
Step 4: Watch the long end on “good news” days. A useful test of this thesis is simple. When oil falls on peace headlines, does the 30-year yield fall with it? If 2-year yields drop but 30-year yields barely move, that would support the idea that persistent influences are keeping the long end elevated. Repeated episodes would be more informative than one day’s trading, and they would support the thesis rather than establish a permanent floor.
What would prove me wrong
- Breakevens rise materially and persistently, for example, above ~2.6% at the 10-year. That is my monitoring threshold, not a universal dividing line. It would challenge the view that this is mainly a real-yield story, especially if survey expectations and other inflation measures also rise.
- The labor market cracks. A recession could revive safe-haven demand and reverse expected policy tightening quickly. A 10-year below my base-case range, potentially even below 4%, becomes plausible. The curve could steepen if short-term yields fall faster than long-term yields.
- Policy or investor demand compresses the term premium. Serious fiscal consolidation, stronger demand for duration, or renewed Fed purchases concentrated in longer bonds could weaken the case for a persistent 1% term premium.
What it means in practice (general framework, not advice)
- Savers: Quoted TIPS real yields around these levels are historically high. An individual TIPS held to maturity can provide a stated real yield linked to CPI, before taxes and fees. That is different from promising a fixed realized total return each year: coupon reinvestment matters, and selling early exposes you to market-price changes.
- Borrowers: I wouldn’t build a plan around mortgages with a 3% handle coming back. In my framework, even a benign outcome could leave 30-year mortgage rates in the 6s, depending on mortgage spreads. That is a scenario, not a guaranteed minimum.
- Stock investors: A higher real discount rate hits long-duration assets hardest, all else equal: unprofitable growth, long-dated projects, and richly valued stocks. Earnings growth becomes especially important when higher bond yields make further valuation expansion harder to justify.
Interest rates are the price of money, and that price has risen sharply in real terms. The war contributed to the speed of the move. But government financing needs, private demand for capital, and investors’ required compensation for long-term risk can outlast the immediate shock. That’s why I expect a higher normal range, while recognizing that the economy and the term premium could prove me wrong.
Glossary
- Basis point (bp): 0.01 percentage point. 100 bp = 1 percentage point.
- Breakeven inflation compensation: the gap between comparable nominal Treasury and TIPS yields reflects expected inflation plus risk and liquidity effects.
- Coupon: a bond’s stated interest rate, used to calculate its interest payments.
- Duration: a measure of sensitivity to changes in yield. Longer maturities generally mean more duration, all else equal.
- Fed funds rate: a market rate for overnight borrowing between eligible institutions; the Fed sets a target range and uses its tools to implement it.
- Inverted curve: short-term yields above long-term yields; often associated with expected rate cuts or slower growth.
- Real yield: a yield expressed in purchasing-power terms. TIPS provide a market measure tied to CPI, before taxes and fees.
- Term premium: a model-estimated component of yield reflecting compensation for holding a longer bond instead of rolling short-term investments. It can be negative.
- Yield to maturity: the annualized rate that relates a bond’s price to its remaining promised cash payments. It is not the same as its coupon or a guarantee of the investor’s realized compounded return.
This article is for informational and educational purposes only and does not constitute investment advice. Nominal curve data are as of September 24, 2026; the matched nominal/real comparison is through September 23. Other observations are dated where used. Markets move quickly.
Sources
- U.S. Treasury, Daily Par Yield Curve Rates — September 2026 and February 2026.
- U.S. Treasury, Daily Par Real Yield Curve Rates — September 2026 and February 2026.
- U.S. Treasury, Interest Rate Statistics and methodology.
- TreasuryDirect, Treasury marketable securities and TIPS.
- FINRA, Understanding Bond Yield and Return.
- Federal Reserve, FOMC statement, September 16, 2026, and implementation note.
- Federal Reserve, September 2026 Summary of Economic Projections.
- Bureau of Labor Statistics, August 2026 CPI release.
- S&P Global, September flash PMI: fastest U.S. growth in more than five years.
- Congressional Budget Office, The Budget and Economic Outlook: 2026 to 2036.
- TreasuryDirect, September 17, 2026 TIPS auction result.
- FRED, 10-Year Breakeven Inflation Rate (T10YIE), 10-Year TIPS yield (DFII10) and Kim–Wright 10-Year Term Premium (THREEFYTP10).
- Federal Reserve, Three-Factor Nominal Term Structure Model.
- Federal Reserve, interpreting market measures of policy and inflation expectations.
- Federal Reserve Bank of New York, Disentangling Messages from the Treasury Market.
- Federal Reserve Bank of New York, Treasury Term Premia: 1961–Present.
- Federal Reserve Bank of New York, Treasury rollover FAQs and December 2025 reserve-management purchase statement.
- Freddie Mac, Primary Mortgage Market Survey.
- Federal Reserve, FOMC meeting calendar and BLS, CPI release schedule.
- CNBC, Treasury market report, September 24, 2026.

